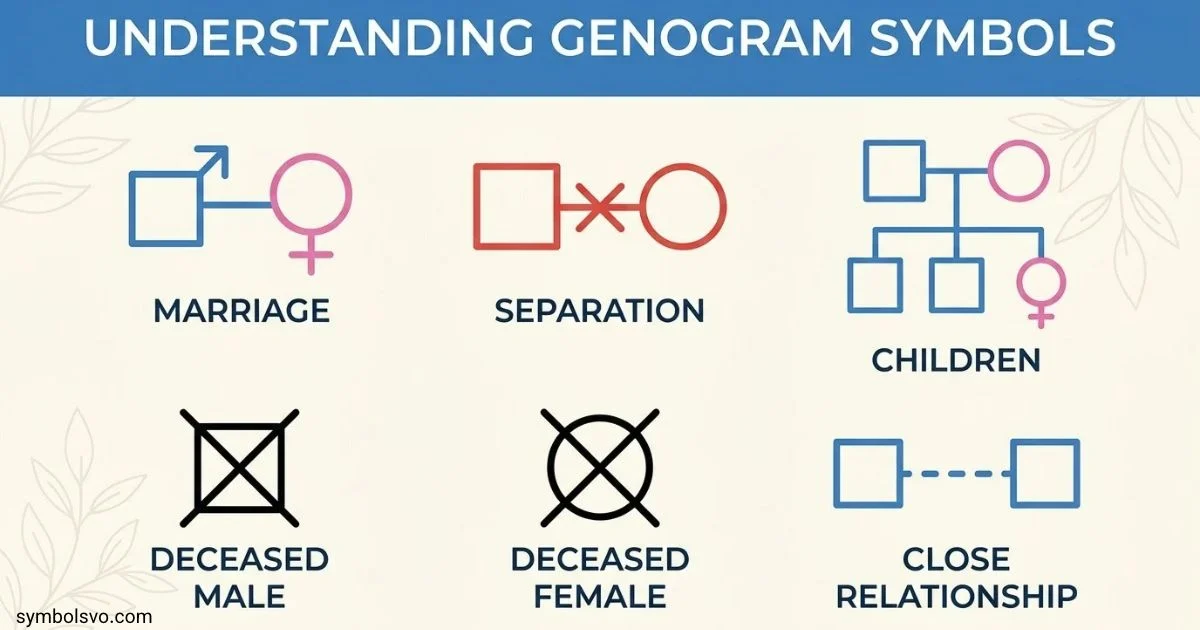
Genogram symbols help you turn a complicated family history into a clear visual map. They show who belongs to a family, how people are connected, and which relationship patterns or health details may matter. Unlike a basic family tree, a genogram can also record emotional bonds, separation, adoption, significant life events, and selected medical information.
This guide explains the most common genogram symbols and meanings, including people symbols, family relationship lines, pregnancy symbols, adoption and twin markers, emotional relationship patterns, and health annotations. You’ll also learn how to read a genogram symbols chart, create your own genogram, and avoid mistakes when interpreting one.
One important point: genogram notation can vary between textbooks, clinical settings, and software. Use a consistent symbol system and include a genogram key or legend so readers understand exactly what your diagram means. The widely used conventions associated with Monica McGoldrick and colleagues provide a useful starting point.
What Are Genogram Symbols?
Genogram symbols are shapes, lines, marks, and annotations used to represent people and their family connections. Together, they create a visual record of family structure and selected information about relationships, health, and major life events.
A genogram often covers three generations, such as grandparents, parents, and children. However, you can include more generations when the available information and purpose of the diagram call for it.
A genogram commonly has three layers:
- Individual symbols: Identify people and show details such as life status or the person at the center of the assessment.
- Family structure lines: Connect partners, parents, and children. Additional marks can show marriage, separation, divorce, adoption, or other family arrangements.
- Relationship and health annotations: Record relevant emotional connections, medical history, and significant events.
For example, a family tree might show that two people are married and have three children. A genogram can show the same structure while also recording that one child was adopted, two relatives have a history of a particular medical condition, and a parent and adult child describe their relationship as distant.
The extra detail can help family therapists, counselors, social workers, healthcare professionals, researchers, and families organize information. However, a genogram is a visual reference tool, not a diagnosis. A line or symbol alone cannot establish why a relationship works a certain way or whether someone has a medical or mental health condition.
Genogram Symbols and Meanings Chart
The following chart summarizes common symbols used in traditional genograms. The exact appearance of some markers differs between systems, so check the legend supplied with your textbook, workplace template, or genogram software.
| Genogram symbol | Common meaning | Important note |
| Square | Male person | Traditional notation |
| Circle | Female person | Traditional notation |
| Diamond | Gender or sex unspecified in some systems | Meaning varies; label respectfully when appropriate |
| X through a square or circle | Deceased person | Add dates when known and relevant |
| Double outline | Identified person or person of focus | Often called the index person |
| Horizontal line between two people | Couple or partner relationship | The line style may identify the relationship type |
| One slash across or below a partner line | Separation in many systems | Record the date if known |
| Two slashes across or below a partner line | Divorce in many systems | Check the diagram’s notation |
| Vertical line from a parent connection to a child | Parent-child connection | Biological and non-biological connections may use different markers |
| Dashed or dotted child connector | Adoption or foster care in some systems | Include a legend to distinguish the two |
| Triangle | Pregnancy in some traditional systems | Pregnancy outcome markers vary |
| Twin branches from one point | Twins | A connecting bar may indicate identical twins |
| Two parallel relationship lines | Close relationship in many systems | This describes a reported pattern, not a diagnosis |
| Three parallel relationship lines | Very close or fused relationship in some systems | Interpret in context |
| Zigzag line | Conflictual relationship in many systems | Record the source or context when needed |
| Broken or specially marked line | Emotional cutoff or estrangement in some systems | Exact notation varies |
| Shading or a written health label | A health condition or other selected characteristic | The legend must explain the meaning |
This chart is a quick reference, not a universal codebook. For instance, a dashed line may mean one thing when connecting partners and another when connecting a child to parents. Always read the line in context.
Basic Genogram Symbols for Individuals
Individual symbols form the foundation of a genogram. Each person receives a shape, and additional marks or labels provide relevant details.
Square Symbol in a Genogram
A square represents a male person in traditional genogram notation. It may contain a name, age, or other brief information depending on the diagram’s format.
For example, a square labeled “David, 68” could represent a grandfather. A line connecting that square to another person’s symbol may indicate a partnership, while a line descending toward a child symbol can show a parent-child connection.
The square identifies the person within the chosen notation system. It does not tell you anything about their personality, role in the family, or relationship quality.
Circle Symbol in a Genogram
A circle represents a female person in traditional genogram notation. Like the square, it can be labeled with a name, age, birth date, or other relevant details.
A circle connected to a square by a partner line may represent a couple. A vertical connection from the couple’s family line can lead to their children.
When documenting real people, do not assume that a traditional symbol captures every aspect of someone’s identity. If gender identity is relevant, use respectful language and make the diagram’s notation clear.
Diamond or Unspecified-Person Symbol
Some genogram systems use a diamond to represent a person whose sex or gender is unknown or unspecified. The precise meaning depends on the notation being followed.
A diamond can be useful when a family record mentions a relative but provides too little information to assign another symbol confidently. It is better to label the information as unknown than to guess.
A diamond should not automatically be used to represent every nonbinary person. There is no single symbol that is used consistently across all genogram systems for every gender identity. Follow the requirements of your chosen system and prioritize accurate, respectful labeling.
Deceased Person Symbol
An X through a person’s symbol commonly indicates that the person has died. The underlying shape remains visible, preserving the person’s representation in the family structure.
When useful and appropriate, add the person’s birth and death dates or years. If the exact date is unknown, do not invent one.
A deceased person usually remains connected to their relatives in the genogram. Removing the person would erase relevant family structure and could make relationships across generations harder to understand.
Index Person or Identified Person Symbol
The index person is the individual who is the main focus of a genogram. Some systems use a double outline around that person’s symbol.
For example, a genogram created during a family counseling assessment might focus on one adult, while a healthcare genogram might focus on a patient’s family medical history.
The index person is not necessarily the oldest, youngest, or most important member of the family. The designation simply identifies whose circumstances prompted or guide the diagram.
Names, Ages, and Dates
Symbols are easier to interpret when they include enough supporting information. Depending on the purpose, a genogram may include:
- Names or initials
- Birth dates or birth years
- Death dates or years
- Marriage, separation, or divorce dates
- Significant family events
- Brief notes explaining uncertain or disputed information
Avoid filling every shape with too much text. Keep the diagram readable and place longer notes beside it or in a separate reference section.
Genogram Relationship Lines and Their Meanings
Genogram relationship lines show how people connect. The position and style of a line can communicate different information, so it helps to distinguish structural connections from emotional relationships.
Marriage and Partner Lines
A horizontal line between two person symbols commonly represents a couple or partnership. In traditional notation, a solid line may indicate marriage.
A label or date can provide more context. For example, a couple line marked “1998” may record the year a marriage began.
Do not assume every horizontal line means a legal marriage. Some genograms distinguish marriage, cohabitation, and other partnerships through different line styles or annotations.
Separation Symbol
A single slash across or near a couple line commonly represents separation in many traditional systems.
A date can show when the separation occurred. This matters when a family has experienced multiple partnerships or changes in household arrangements.
Separation does not automatically mean that the couple divorced or stopped communicating. The symbol records a defined relationship event, not every detail of what followed.
Divorce Symbol
Two slashes across or near the couple line commonly indicate divorce in many genogram systems.
A divorce marker helps distinguish a past marriage from a current partnership. If someone later remarries, the genogram can show both relationships and connect children to the appropriate parent or parents.
Always check the selected notation because the placement and style of separation and divorce marks can differ between references.
Cohabitation and Other Partnerships
Some systems use a dashed line to represent cohabitation or a committed relationship without marriage. Other systems use different marks for dating, engagement, or informal partnerships.
If you need to represent a family structure that does not fit the standard template, use a clear label rather than inventing an unexplained symbol.
The purpose is to represent the relationship accurately—not to force every family into a traditional structure.
Parent-Child Connection Lines
A vertical line that descends from a parent or couple connection commonly links the adults to their children. A sibling line then connects the children’s branches.
Children are often arranged from oldest to youngest, moving from left to right. This convention makes birth order easier to follow when several children share the same parents.
When a child has more than one parental household, or when parentage is complex, take care to show the relationships clearly. A note can distinguish biological, adoptive, foster, step-parent, and caregiving relationships when that distinction matters.
Pregnancy and Pregnancy Loss Symbols
Some genogram systems use a triangle to represent a pregnancy. Additional symbols or written labels may distinguish pregnancy outcomes, but these conventions are not identical across all references.
Common topics that may appear in this part of a genogram include:
- Current or historical pregnancy
- Miscarriage or spontaneous pregnancy loss
- Induced abortion
- Stillbirth
- Other relevant reproductive events
A specific marker should be used only when the legend defines it. For example, a small triangle may indicate pregnancy in one system, while additional marks distinguish different outcomes in another. Do not assume a triangle alone tells you what happened.
Pregnancy and pregnancy loss can be sensitive personal information. Include these details only when they are relevant to the purpose of the genogram and appropriate to document. Use neutral wording, protect privacy, and avoid adding details that the person has not chosen to share.
If you are preparing a genogram for a class, clinical setting, or professional assessment, follow the assigned notation guide rather than mixing symbols from several sources.
Adoption, Foster Care, Biological Children, and Twins
Family structure can include biological relationships, adoption, foster care, stepfamilies, guardianship, and other caregiving arrangements. A well-prepared genogram should make the relevant connections understandable without treating one family arrangement as more legitimate than another.
Biological Child Symbol
A solid parent-child connection commonly shows a parent-child relationship in traditional genograms. When the biological connection is important to the purpose of the diagram, label it clearly or use the notation required by the chosen system.
A biological connection and an emotional relationship are different kinds of information. A genogram can show that someone is a biological parent while also documenting a distant or conflictual relationship, provided the information is relevant and appropriately sourced.
Adopted Child Symbol
Some systems use dashed or dotted lines to represent adoption. Other systems may use brackets, labels, or different line conventions.
For clarity, write “adopted” where appropriate or include the exact symbol in the legend. Do not rely on a dashed line without explaining what it means in your diagram.
Adoption records can be sensitive. Include biological family connections, adoptive family connections, or adoption history only when they are relevant and appropriate to the genogram’s purpose.
Foster Care and Step-Family Relationships
Foster care, guardianship, and step-parent relationships may need different annotations. A single generic child line can be confusing when a diagram contains multiple types of family connection.
Use labels such as “foster parent,” “step-parent,” or “guardian” when the relationship needs clarification. If the genogram concerns a child’s current living arrangements, distinguish those arrangements from biological or legal parentage.
Twin and Identical-Twin Symbols
Twins are commonly shown by connecting two child branches to the same point. Some systems use an additional connecting bar between the twin branches to indicate identical twins.
The exact notation varies, so use a legend to identify the symbol. Do not infer whether twins are identical from appearance or family assumptions; record that information only when it is known.
Birth Order
Children are commonly arranged from oldest to youngest from left to right. Birth order can help readers follow sibling relationships, especially in larger families.
If the order is unknown, make that uncertainty clear instead of arranging children based on guesswork.
Emotional Relationship Symbols in a Genogram
A genogram can show more than biological or legal connections. Emotional relationship symbols help document how family members describe their relationships, including closeness, distance, conflict, or estrangement.
These lines should be interpreted carefully. They represent a reported relationship pattern at a particular time, not a permanent judgment about someone’s character.
| Relationship pattern | Common notation | What it may communicate |
| Close relationship | Two parallel lines | The people describe a strong emotional bond |
| Very close or fused relationship | Three parallel lines in some systems | The relationship may involve unusually high closeness or limited boundaries |
| Distant relationship | Dashed or specially marked line in some systems | Limited contact or emotional distance |
| Conflictual relationship | Zigzag line | Repeated disagreements or tension |
| Estrangement or cutoff | Broken or specially marked line | Little or no contact, or a significant relational break |
| Mixed close and conflictual relationship | Combined line patterns | Both closeness and conflict are present |
These are common examples rather than universal definitions. The legend and source of the information determine how each line should be read.
Close and Very Close Relationships
Two parallel lines may represent a close relationship, while three parallel lines may represent a very close or fused relationship in some systems.
For example, an adult child may describe a parent as their main source of support. Another family might describe a relationship in which relatives have difficulty maintaining personal boundaries.
The word fused has a more specific meaning in some family therapy frameworks than simply being close. Avoid labeling a relationship as unhealthy based on closeness alone.
Distant Relationships
A dashed or otherwise distinct line may represent emotional distance, depending on the symbol system.
Distance can have many explanations. Family members might live far apart, communicate infrequently, have unresolved disagreements, or simply prefer less contact. The line cannot explain the reason by itself.
If the reason matters, record it as a short, attributed note rather than treating it as an established fact.
Conflictual or Hostile Relationships
A zigzag line commonly represents conflict in many genogram references. It may be used when family members report recurring tension or disagreements.
A conflict marker should not be treated as proof that either person is responsible for the problem. Where possible, distinguish a person’s account from an independently established event.
Emotional Cutoff and Estrangement
Some systems use a broken line or another special mark to represent estrangement or emotional cutoff.
This can help distinguish a relationship that involves little or no contact from one that remains active but distant. However, the line does not tell you why contact stopped, whether the decision was mutual, or whether reconnecting would be appropriate.
A genogram should document the relevant facts without pressuring family members to restore contact or revealing sensitive details unnecessarily.
Abuse, Safety, and Sensitive Relationship Information
Some specialized genograms record abuse, neglect, or other safety concerns. The markers and documentation practices vary, and these details require particular care.
If such information is necessary for a professional assessment, use the required reporting conventions and clearly distinguish allegations, disclosures, documented findings, and unknown information. Do not use a relationship line alone to imply that abuse has been established.
Health and Medical History Symbols in a Genogram
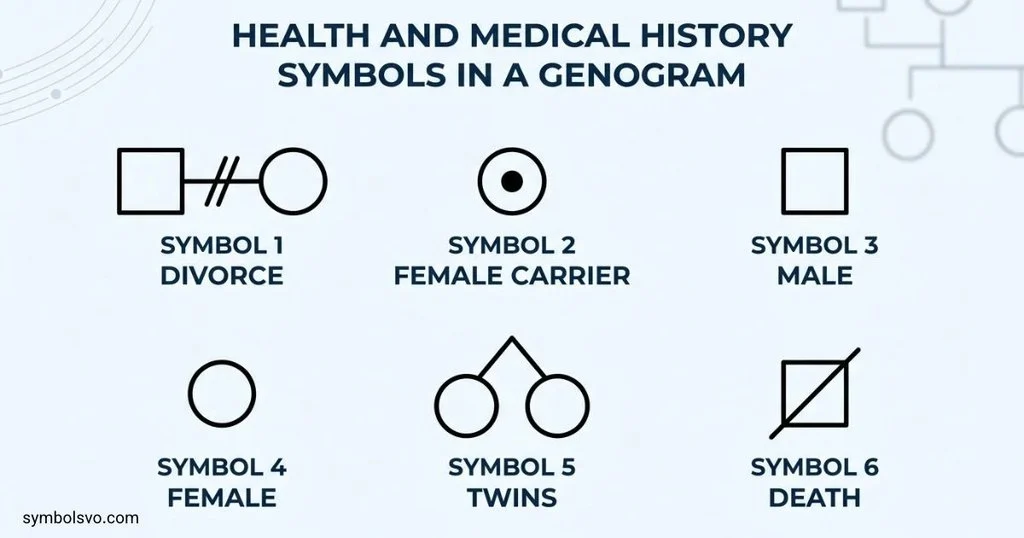
A medical genogram can help organize selected health information across generations. It may show which relatives have reported or documented conditions and how those relatives are connected.
Some systems use shading, patterns, abbreviations, or written labels inside or beside person symbols. There is no single fill color or shading pattern that should be assumed to mean the same thing in every genogram.
For that reason, a useful medical genogram includes a legend explaining every health marker.
Physical Health Conditions
Depending on the purpose, a genogram may record family history related to:
- Cardiovascular conditions, such as heart disease
- Certain cancers
- Diabetes and other metabolic conditions
- Neurological conditions
- Respiratory conditions
- Autoimmune conditions
- Musculoskeletal disorders
- Other inherited or medically relevant conditions
The diagram should distinguish between a confirmed diagnosis, a condition reported by a relative, and information that remains uncertain.
For example, if several relatives reportedly had heart disease, a medical genogram can show those relatives and their connections. That pattern may help a healthcare professional decide which follow-up questions to ask. It does not, by itself, determine an individual’s risk or establish a genetic cause.
Mental Health Conditions
When relevant and appropriate, a genogram may record a reported or diagnosed mental health condition. Use clear labels and avoid implying that a condition is present when the information is unconfirmed.
Mental health information is especially sensitive. A diagram should not become a place to record speculation, rumors, or stigmatizing descriptions.
If a condition is not known, leave it unspecified or use a clearly defined notation for unknown information.
Substance Use and Recovery
Some specialized genograms include annotations for alcohol or other substance use, treatment, or recovery. Their exact symbols differ across systems.
If this information is relevant to an assessment, describe it neutrally. Distinguish historical information from current information and avoid reducing a person to a single behavior or diagnosis.
Genetic Pedigree Versus Medical Genogram
A genetic pedigree chart focuses on biological relationships and the inheritance of particular traits or conditions. A broader medical genogram may include additional family structure, relationship information, and relevant life events.
These tools overlap, but they are not interchangeable in every clinical situation. If a question involves inherited disease, a healthcare professional may need a formal pedigree and a detailed medical history rather than a general family genogram.
A genogram can organize information for discussion, but it cannot replace genetic counseling, diagnostic testing, or a professional medical assessment.
Specialized Types of Genograms
Different genogram types focus on different questions. The same family may need more than one diagram if the goal changes.
| Genogram type | Main focus | Information it may include |
| Family therapy genogram | Family structure and relationships | Partnerships, children, emotional connections, and significant events |
| Medical genogram | Family health history | Conditions, ages at diagnosis when known, and relevant health patterns |
| Genetic pedigree | Biological inheritance | Biological relatives and the occurrence of a particular trait or condition |
| Cultural genogram | Cultural identity and family background | Heritage, migration, languages, traditions, and significant cultural experiences |
| Spiritual or religious genogram | Family spiritual background | Religious affiliation, traditions, changes in practice, and relevant experiences |
| Life-event or timeline genogram | Major changes over time | Births, deaths, moves, separations, and other important events |
Family Therapy Genograms
A family therapy genogram helps organize information about family structure and reported relationship patterns. It can give a therapist and family members a shared visual reference during a discussion.
It may also help identify questions about recurring experiences across generations. Those patterns should be explored through conversation rather than assumed to have a single explanation.
Medical Genograms
Medical genograms focus on health information that is relevant to a clinical question. The diagram may help a patient organize their family history before speaking with a healthcare professional.
A medical genogram should identify the source of uncertain information when possible. It should also protect relatives’ privacy and avoid unnecessary details.
Cultural Genograms
A cultural genogram can explore family heritage, migration, language, traditions, and experiences that influence family life.
It should not assume that every family member shares the same beliefs or cultural identity. Family members may understand their heritage differently, even when they grew up in the same household.
Spiritual and Religious Genograms
A spiritual or religious genogram may record traditions, changes in religious practice, or significant experiences that affect family relationships.
This type of diagram should reflect the information participants consider relevant. It should not make assumptions about a person’s beliefs based solely on their relatives’ affiliations.
Genograms About Sensitive Topics
Some diagrams cover topics such as sexuality, trauma, family estrangement, or other personal experiences. Use these only when relevant to the task and with appropriate attention to consent, confidentiality, and respectful language.
A genogram does not need to include every fact about a family. Its value comes from recording the information needed for a specific purpose.
How to Read a Genogram Correctly
A crowded genogram can be confusing at first. The easiest approach is to read it in layers instead of trying to interpret every symbol simultaneously.
- Find the legend. Check what each shape, line, fill, and abbreviation means in that specific diagram.
- Identify the person of focus. Look for the double outline or another marker identifying the index person, if the diagram uses one.
- Follow the generations. Start with the oldest generation shown and move toward the younger generations.
- Trace partnerships and children. Follow horizontal partner lines and vertical parent-child connections.
- Check life-status marks. Look for an X or other marker indicating death, and read dates where provided.
- Read emotional relationship lines. Use the legend to identify closeness, distance, conflict, or cutoff.
- Review health and event annotations. Read them as recorded information, not proof of a cause or diagnosis.
- Notice gaps and uncertainty. A missing date or unrecorded relationship does not automatically mean that information was deliberately hidden.
Example: Reading a Three-Generation Genogram
Imagine a fictional family diagram with grandparents at the top, their adult children in the middle, and grandchildren at the bottom.
- One grandparent’s symbol contains an X, indicating that the person has died.
- A horizontal line connects the two grandparents, and a vertical branch connects them to their children.
- One adult child is marked as the index person.
- The index person has two children, shown beneath the appropriate parent connection.
- A zigzag line between the index person and a sibling indicates reported conflict according to the diagram’s legend.
- A health annotation records a condition reported in one grandparent.
Reading the diagram in layers reveals family structure, a reported relationship pattern, and a piece of health history. It does not prove that the conflict caused the health condition or that the grandchildren will develop it.
That distinction is essential: genograms help people organize and discuss information, while explanations require context and, when appropriate, professional assessment.
How to Create a Family Genogram Step by Step
You do not need to include every possible symbol to create a useful genogram. Start with the information required for your goal, then add detail where it helps.
Step 1: Define the Purpose
Decide why you are creating the diagram. A school assignment may require only family structure, while a medical genogram may focus on health history.
The purpose determines which details belong in the diagram and which should remain private.
Step 2: Gather Family Information
Collect the relevant names, relationships, dates, and other information. Ask family members for details when appropriate, and distinguish what they report from what you can confirm.
If information is missing, mark it as unknown rather than guessing.
Step 3: Draw the Family Structure
Begin with the oldest generation you need to include. Add the next generation below it and connect partners, parents, and children using the chosen notation.
Arrange siblings in birth order if that is part of the system you are following.
Step 4: Add Relationship and Life-Status Markers
Record marriages, separations, divorces, deaths, adoption, twins, or other relevant family connections. Use only symbols that fit the purpose of the diagram.
Keep the basic structure readable before adding extra information.
Step 5: Add Emotional or Health Annotations
Include emotional relationship lines or health details only when they are relevant and supported by the information available.
Do not use a genogram to diagnose relatives or label a relationship based on one unexplained symbol.
Step 6: Create a Clear Genogram Key
Add a genogram legend that defines each symbol and line style used in your diagram. This is especially important when you use software-specific symbols or a custom notation system.
For example, if a dashed line means cohabitation between partners but adoption between a parent and child, explain those separate meanings in the key.
Step 7: Review and Update the Diagram
Check that each person is connected correctly, the generations are easy to follow, and the labels are readable. Ask whether every included detail is relevant and appropriate to share.
A genogram may need updating as family circumstances or available information change. Date the diagram when that helps readers understand when it was created.
Genogram Symbols vs. Family Tree vs. Pedigree Chart
These three diagrams can look similar, but they serve different purposes.
| Feature | Genogram | Family tree | Genetic pedigree |
| Main purpose | Map family structure and selected relationship patterns | Show family ancestry and connections | Track inheritance of traits or conditions |
| Family relationships | Often includes emotional relationship patterns | Usually focuses on family connections | Focuses on biological relationships relevant to inheritance |
| Medical history | May include health information | Usually limited | Central when investigating a specific inherited trait or condition |
| Emotional bonds | May include closeness, conflict, distance, or cutoff | Usually not included | Usually not the focus |
| Adoption and other family arrangements | Can include them using a defined notation | May include them, depending on the tree | Requires careful distinction between biological and non-biological relationships |
| Typical use | Family therapy, social work, healthcare, family-history discussions | Genealogy and ancestry | Genetics and medical assessment |
Which one should you choose?
- Choose a genogram when you need to understand family structure alongside relevant relationship patterns or life events.
- Choose a family tree when your main goal is to record ancestry and family connections.
- Choose a genetic pedigree when the main question concerns inheritance or a specific health condition.
A family tree can be a starting point for a genogram, but the additional annotations make the two diagrams different tools.
Best Practices for Using Genogram Symbols
A good genogram should be accurate, easy to read, and appropriate for its intended audience.
Use One Consistent Symbol System
Do not combine symbols from different references without explaining the differences. A dashed line might represent cohabitation in one context and adoption in another.
Choose the notation required for your assignment or professional setting. If you adapt it, document the changes in the legend.
Include a Legend
A genogram key prevents readers from guessing what a symbol means. It should explain every non-obvious mark, including any colors, shading, abbreviations, or custom relationship lines.
A legend is especially useful when a diagram includes both structural and emotional relationship lines.
Keep the Diagram Readable
Avoid crowding person symbols with long descriptions. Use brief labels and move detailed explanations to a separate note when necessary.
For large families, consistent spacing and clear generation levels make the diagram easier to follow.
Use Colors Carefully
Color can help distinguish categories, but it should never be the only way to communicate important information. A printed copy may appear in grayscale, and some readers may have difficulty distinguishing certain colors.
Pair colors with line styles, labels, or patterns. Explain every color in the legend.
Distinguish Facts From Reports and Assumptions
A genogram should not present an assumption as a confirmed fact.
For example, if a relative says that a family member had a particular condition but records are unavailable, document the information as reported rather than confirmed. If the source is unknown, say so when relevant.
Respect Privacy and Consent
Genograms may contain names, health details, family conflicts, adoption histories, and other sensitive information. Include only what is needed for the task.
Before sharing a diagram, consider who will see it, whether the information is appropriate to disclose, and whether identifying details can be minimized.
Avoid Overinterpreting Patterns
A genogram may reveal that a particular experience or condition appears in multiple generations. That observation can suggest useful questions, but it does not establish cause and effect.
For example, several relatives having a similar health condition does not prove that every family member inherited it. Likewise, a relationship pattern across generations does not prove that one person caused it.
Use the diagram as a starting point for careful discussion, not as a substitute for evidence.
Genogram Makers, Templates, and Printable Symbol Charts
You can create a genogram on paper or with a digital tool. The right method depends on the size of the family, the complexity of the information, and whether you need to revise or share the diagram.
Paper Genogram Template
A paper template works well for a small family diagram or a classroom exercise. Draw the person symbols, connect the relationships, and add a legend at the bottom or beside the diagram.
Before adding emotional or health annotations, check that there is enough room to keep the lines separate and readable.
Digital Genogram Software
A digital genogram maker can help you move symbols, edit relationships, and expand the diagram as you gather information. Some tools also provide templates, export options, and built-in symbol keys.
One example is WebGeno, which has been associated with genogram-related documentation and tools. Check the current features and notation supported by any software before relying on it for a formal assignment or professional record.
Remember that a software tool may include extra symbols that are not part of the convention required by your course or workplace.
Printable Genogram Symbols Chart or PDF
A printable genogram symbols chart is useful when you need to reference the notation while drawing. Ideally, the chart should include:
- Person symbols and life-status markers
- Marriage, separation, and divorce lines
- Parent-child connections
- Adoption, foster care, and twin notation
- Emotional relationship symbols
- Health annotations, if relevant
- A short explanation of the system being used
A chart is most useful when it identifies its source and explains variations. Avoid assuming that every downloadable chart uses exactly the same notation.
Frequently Asked Questions About Genogram Symbols
What are the most common genogram symbols?
The most common traditional genogram symbols include a square for a male person, a circle for a female person, an X through a person symbol to indicate death, and lines connecting partners, parents, and children. Additional marks may represent separation, divorce, adoption, twins, emotional relationships, and health information. Always check the legend.
What does a square mean in a genogram?
A square traditionally represents a male person. It may contain a name, age, or other relevant information. Additional marks can indicate life status or the person’s role in the diagram.
What does a circle mean in a genogram?
A circle traditionally represents a female person. The circle remains the person’s main symbol even when additional marks are added to show death or other relevant information.
What does an X through a genogram symbol mean?
An X through a square or circle commonly indicates that the person has died. Birth and death dates may be added when known and relevant.
What do lines mean in a genogram?
Lines show connections between people. Horizontal lines often represent partnerships, while vertical lines connect parents and children. Other line styles can indicate separation, divorce, adoption, or emotional relationship patterns. Their exact meanings depend on the chosen notation.
How do you show marriage, separation, and divorce in a genogram?
A solid horizontal line commonly represents marriage or a couple relationship. One slash often marks separation, while two slashes often mark divorce. These are common conventions, but the diagram’s legend should define the marks.
How do you show an adopted child in a genogram?
Some genogram systems use a dashed or dotted line to represent an adopted child. Others use different markers or labels. Use the notation required by your source and explain it in the legend.
What does a triangle mean in a genogram?
A triangle commonly represents a pregnancy in some traditional genogram systems. Additional marks or labels may distinguish pregnancy outcomes. Because the conventions vary, a triangle should not be interpreted without checking the legend.
What do three parallel lines mean in a genogram?
In some systems, three parallel lines indicate a very close or fused emotional relationship. The symbol should be interpreted according to the diagram’s notation and the information provided about the relationship.
What do shaded symbols mean in a genogram?
Shading may identify a medical condition, a selected personal characteristic, or another category defined by the diagram. There is no universal meaning for every shade or color, so the legend is essential.
How many generations should a genogram include?
Three generations are common: grandparents, parents, and children. You can include additional generations when the purpose of the diagram requires them and the information is available.
Who developed genogram symbols?
Genogram methods evolved through family systems and family therapy practice. Murray Bowen’s work helped establish the family systems framework, while Monica McGoldrick, Randy Gerson, and colleagues contributed influential genogram notation and assessment resources. Different educational and professional references may use variations of the symbols.
Is a genogram the same as a family tree?
No. A family tree primarily shows ancestry and family connections. A genogram can also record emotional relationships, health history, significant life events, and other information relevant to its purpose.
Can I use genogram symbols to diagnose a family member?
No. A genogram organizes information; it does not establish a diagnosis. Health conditions and emotional relationship patterns need appropriate context and, when relevant, professional assessment.
Final Thoughts on Genogram Symbols and Meanings
Genogram symbols make complex family information easier to organize and discuss. Person shapes identify family members, structural lines connect partners and children, and additional markers can document life events, emotional relationships, adoption, twins, or relevant health history.
The key to an accurate genogram is consistency. Follow one notation system, add a clear legend, label uncertain information, and protect sensitive family details. Most importantly, interpret the diagram in context rather than treating a symbol as proof of a diagnosis or an explanation for family behavior.
With those principles in place, a genogram becomes a useful visual reference for understanding family structure and identifying questions that deserve closer attention.

Mason Ellington is a creative and dedicated Content Writer and Symbols Expert with a passion for words, communication, and symbolic meanings. He specializes in crafting engaging, informative, and well-structured content while exploring the deeper meanings and interpretations behind symbols. With a creative mindset and attention to detail, Mason transforms ideas into meaningful content that informs, inspires, and connects with readers. His expertise combines powerful storytelling, clear communication, and a deep understanding of symbolism.
 Nathan Holloway
 Daniel Brooks