Have you ever looked at a statistics formula and wondered what all those unfamiliar symbols mean? I know that understanding mathematical notation can feel confusing, especially when every symbol seems to have a different purpose.
Statistics symbols help you understand data, interpret formulas, and solve mathematical problems more confidently. Once you learn what each symbol means, even complicated statistical equations become much easier to understand.
In this guide, I’ll explain common statistics symbols, their meanings, and how you can use them in real examples. Whether you’re a student, researcher, or beginner, you’ll find the essential notation you need to make statistics simpler.
Statistics Symbols List
Statistics uses symbols to represent populations, samples, averages, spread, proportions, relationships, and probability. Learning the most common ones makes formulas easier to read and helps you understand what a statistical calculation is measuring.
| Symbol | Name | Common meaning |
| (N) | Population size | Number of members in a population |
| (n) | Sample size | Number of observations in a sample |
| (\mu) | Mu | Population mean |
| (\bar{x}) | X-bar | Sample mean |
| (\sigma) | Sigma | Population standard deviation |
| (\sigma^2) | Sigma squared | Population variance |
| (s) | Sample standard deviation | Spread of sample observations |
| (s^2) | Sample variance | Variance calculated from sample data |
| (p) | Population proportion or probability | Meaning depends on context |
| (\hat{p}) | P-hat | Sample proportion |
| (q) | Complement of a probability or proportion | Often (1-p) in a binary setting |
| (r) | Correlation coefficient | Sample linear correlation |
| (\rho) | Rho | Population correlation coefficient |
| (\beta) | Beta | Often a regression coefficient or Type II error probability |
| (\alpha) | Alpha | Often a significance level or Type I error probability |
| (z) | Z-score or standard normal value | Standardized value or test statistic |
| (t) | T-statistic | Test statistic used in t-procedures |
| (\chi^2) | Chi-square | Test statistic or distribution notation |
| (df) | Degrees of freedom | Number of independent values used in a calculation |
| (\sum) | Summation | Add a sequence of values |
| (\sqrt{\phantom{x}}) | Square root | A number multiplied by itself gives the value inside |
| (\approx) | Approximately equal to | Values are close, but not necessarily identical |
| (\ne) | Not equal to | Two values differ |
| (\leq) | Less than or equal to | The left value is no greater than the right |
| (\geq) | Greater than or equal to | The left value is no less than the right |
These are common conventions, not a universal dictionary for every field. For example, (p) can mean a population proportion, a probability, or a p-value depending on the formula.
All Statistics Symbols
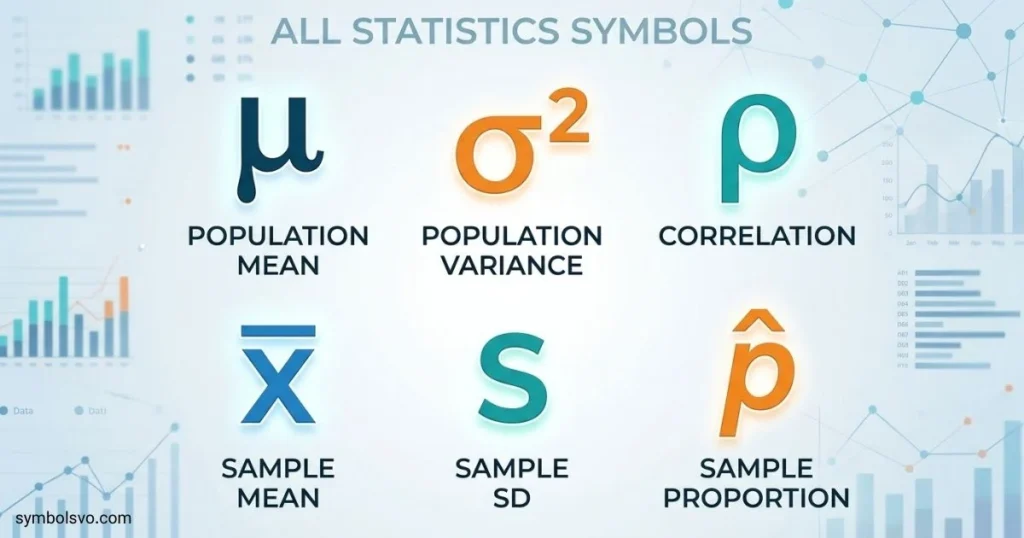
There is no single short list that covers every symbol used across statistics, probability, research, and specialized mathematical fields. The following expanded reference includes many of the symbols students are most likely to encounter.
| Symbol | Meaning | Typical use |
| (\bar{x}) | Sample mean | Average of sample values |
| (\mu) | Population mean | Average of an entire population |
| (M) | Median or another defined quantity | Meaning depends on the source |
| (s) | Sample standard deviation | Describes sample spread |
| (\sigma) | Population standard deviation | Describes population spread |
| (s^2) | Sample variance | Squared measure of sample spread |
| (\sigma^2) | Population variance | Squared measure of population spread |
| (R) | Range or a defined statistic | Often maximum minus minimum |
| (Q_1) | First quartile | Lower quartile |
| (Q_2) | Second quartile | Median |
| (Q_3) | Third quartile | Upper quartile |
| (IQR) | Interquartile range | (Q_3-Q_1) |
| (x_i) | The (i)-th observation | Individual data value |
| (\sum x_i) | Sum of observations | Total of data values |
| (N) | Population size | Number of population members |
| (n) | Sample size | Number of sample observations |
| (\hat{\theta}) | Theta-hat | Estimate of a parameter (\theta) |
| (SE) | Standard error | Estimated or known variability of a statistic |
| (CI) | Confidence interval | Range of plausible parameter values |
| (H_0) | Null hypothesis | Default claim tested |
| (H_a) or (H_1) | Alternative hypothesis | Claim considered against the null |
| (\alpha) | Significance level | Chosen threshold for a statistical test |
| (p\text{-value}) | P-value | Probability, under the null model, of results at least as extreme as those observed |
| (z^*) | Critical z-value | Cutoff used in some confidence intervals |
| (t^*) | Critical t-value | Cutoff from a t-distribution |
| (P(A)) | Probability of event A | Probability notation |
| (A\cap B) | Intersection | Both events occur |
| (A\cup B) | Union | At least one event occurs |
| (A^c) | Complement | Event A does not occur |
| (P(A\mid B)) | Conditional probability | Probability of A given B |
| (\binom{n}{k}) | Binomial coefficient | Number of ways to choose (k) items from (n) |
| (\mathbb{E}(X)) | Expected value | Long-run average of a random variable |
| (\operatorname{Var}(X)) | Variance | Measure of a random variable’s spread |
| (X\sim N(\mu,\sigma^2)) | Normally distributed X | Normal model with mean (\mu) and variance (\sigma^2) |
| (X\sim B(n,p)) | Binomial model notation | In some texts, a binomial random variable |
| (F(x)) | Distribution function or another function | Exact meaning depends on context |
The most useful way to learn a new symbol is to connect it to a concept and a formula. For example, (\bar{x}) represents a sample average, while (\mu) represents the population average that the sample may help estimate.
Common Statistics Symbols
Common statistics symbols appear in introductory courses, exam questions, data analysis, and research summaries. Start with the symbols for sample size, average, spread, proportion, and correlation because these are used in many basic statistical methods.
| Symbol | What it tells you | Example |
| (n) | Number of observations in a sample | (n=30) means 30 observations |
| (\bar{x}) | Sample average | (\bar{x}=12) |
| (\mu) | Population average | (\mu=10) |
| (s) | Sample standard deviation | (s=2.5) |
| (\sigma) | Population standard deviation | (\sigma=3) |
| (\hat{p}) | Sample proportion | (\hat{p}=0.60) |
| (r) | Sample correlation | (r=-0.75) indicates a strong negative linear association in the sample |
| (\sum) | Add values together | (\sum x_i=x_1+x_2+\cdots+x_n) |
| (P(A)) | Probability of event A | (P(A)=0.25) |
| (df) | Degrees of freedom | A one-sample t-procedure commonly uses (df=n-1) |
Symbols That Students Often Confuse
- (\mu) and (\bar{x}): (\mu) is the population mean; (\bar{x}) is the sample mean.
- (\sigma) and (s): (\sigma) is the population standard deviation; (s) is the sample standard deviation.
- (p) and (\hat{p}): (p) often represents a population proportion or probability; (\hat{p}) is commonly the sample estimate of a population proportion.
- (\sigma^2) and (\sigma): Variance is the square of standard deviation, so these are related but not interchangeable.
- (r) and (\rho): (r) commonly describes sample correlation, while (\rho) denotes population correlation.
Remembering these differences will help you choose the correct formula and explain your results accurately.
Statistics Symbols Names and Meanings
Statistics symbols often use Greek letters, Latin letters, subscripts, bars, hats, and mathematical operators. A symbol’s name helps you identify it, while its meaning tells you how it is used in a formula.
| Symbol | Name | Meaning |
| (\mu) | Mu | Population mean |
| (\sigma) | Lowercase sigma | Population standard deviation |
| (\rho) | Rho | Population correlation coefficient |
| (\alpha) | Alpha | Often the significance level |
| (\beta) | Beta | Often a regression coefficient or Type II error probability |
| (\bar{x}) | X-bar | Sample mean |
| (\hat{p}) | P-hat | Estimated population proportion |
| (s) | S | Sample standard deviation in many introductory courses |
| (r) | R | Sample correlation coefficient |
| (\sum) | Capital sigma or summation sign | Sum of a series of values |
| (\sqrt{\phantom{x}}) | Radical sign | Square root |
| (\infty) | Infinity | Unbounded quantity or limit |
| (\Delta) | Capital delta | Change or difference |
| (\approx) | Approximately equal to | Values are close |
| (\propto) | Proportional to | One quantity varies in proportion to another |
| (\mid) | Vertical bar | Often means “given” in conditional probability |
| (\cap) | Intersection | Outcomes shared by two sets or events |
| (\cup) | Union | Outcomes in either or both sets |
The same letter may be reused in different topics. For instance, (\beta) can describe a coefficient in a regression model or the probability of a Type II error. Look at the formula and the topic before deciding what a symbol means.
Statistics Symbols With Examples
Examples show how statistical notation works in real calculations. The same symbol may appear in several formulas, so read the equation as a whole rather than interpreting each letter in isolation.
Mean Symbols
Suppose a sample contains the values (4, 6, 8, 10,) and (12).
The sample mean is:
[
\bar{x}=\frac{4+6+8+10+12}{5}=8
]
Here, (\bar{x}) is the sample mean, and (n=5) is the sample size. If these five values were only part of a larger population, the sample mean could be used to estimate the population mean (\mu).
Standard Deviation And Variance
If the population standard deviation is (\sigma=3), the population variance is:
[
\sigma^2=3^2=9
]
Variance uses squared units, while standard deviation uses the original units of the data. For example, if measurements are in centimeters, the standard deviation is in centimeters and the variance is in square centimeters.
Proportion Symbols
If 18 of 30 surveyed students prefer online notes, the sample proportion is:
[
\hat{p}=\frac{18}{30}=0.60=60%
]
The hat indicates that the value is calculated from sample data. It is an estimate of the corresponding population proportion (p).
Correlation Symbols
A sample correlation of (r=-0.75) suggests a fairly strong negative linear association in the observed data. As one variable increases, the other tends to decrease in a roughly linear pattern. Correlation alone does not prove that one variable causes the other.
Summation Symbol
For values (2, 3,) and (5):
[
\sum_{i=1}^{3}x_i=2+3+5=10
]
The symbol (\sum) tells you to add the values indexed by (i), starting at 1 and ending at 3 in this example.
Statistics Symbols Copy and Paste
Use this copy-and-paste collection to add common statistical symbols to homework, reports, spreadsheets, presentations, or digital notes. Select the symbol you need and copy it into your document.
| Symbol | Name | Copy this |
| (\mu) | Mu | μ |
| (\sigma) | Sigma | σ |
| (\sigma^2) | Sigma squared | σ² |
| (\bar{x}) | X-bar | x̄ |
| (\hat{p}) | P-hat | p̂ |
| (\rho) | Rho | ρ |
| (\alpha) | Alpha | α |
| (\beta) | Beta | β |
| (\Delta) | Delta | Δ |
| (\sum) | Summation | ∑ |
| (\sqrt{x}) | Square root | √ |
| (\infty) | Infinity | ∞ |
| (\approx) | Approximately equal to | ≈ |
| (\ne) | Not equal to | ≠ |
| (\leq) | Less than or equal to | ≤ |
| (\geq) | Greater than or equal to | ≥ |
| (\pm) | Plus or minus | ± |
| (\times) | Multiplication sign | × |
| (\div) | Division sign | ÷ |
| (\pi) | Pi | π |
| (\chi^2) | Chi-square notation | χ² |
| (\cap) | Intersection | ∩ |
| (\cup) | Union | ∪ |
| (\mid) | Vertical bar | | |
| (\in) | Element of | ∈ |
| (\notin) | Not an element of | ∉ |
| (\propto) | Proportional to | ∝ |
| (\therefore) | Therefore | ∴ |
How To Copy Statistical Notation Correctly
Some statistics notation contains more than one character. For example, (x̄) combines the letter x with a combining macron, while (\hat{p}) combines p with a combining circumflex. These may display differently depending on the font and application.
For equations, you can often get more consistent results by using your editor’s equation tool. In a LaTeX-enabled editor, common commands include \mu, \sigma, \bar{x}, \hat{p}, and \sum.
Statistics Symbols Cheat Sheet
This statistics symbols cheat sheet provides a quick review of the notation commonly used in introductory statistics. Use it before an exam or while solving practice problems.
| Concept | Symbol | Quick reminder |
| Population size | (N) | Number of population members |
| Sample size | (n) | Number of sample observations |
| Population mean | (\mu) | Population average |
| Sample mean | (\bar{x}) | Sample average |
| Population standard deviation | (\sigma) | Population spread |
| Sample standard deviation | (s) | Sample spread |
| Population variance | (\sigma^2) | Squared population standard deviation |
| Sample variance | (s^2) | Squared sample standard deviation |
| Population proportion | (p) | Proportion in the population |
| Sample proportion | (\hat{p}) | Proportion in the sample |
| Sample correlation | (r) | Linear association in sample data |
| Population correlation | (\rho) | Linear association in a population |
| Standard error | (SE) | Variability of a statistic’s sampling distribution |
| Significance level | (\alpha) | Chosen threshold for a test |
| Null hypothesis | (H_0) | Claim tested as the starting point |
| Alternative hypothesis | (H_a) | Competing claim |
| P-value | (p\text{-value}) | Measures how extreme the result is under the null model |
| Degrees of freedom | (df) | Depends on the procedure |
| Summation | (\sum) | Add the specified values |
| Interquartile range | (IQR) | (Q_3-Q_1) |
Quick Formula Reference
| Formula | Purpose |
| (\bar{x}=\frac{\sum x_i}{n}) | Calculate the sample mean |
| (R=x_{\max}-x_{\min}) | Calculate the range |
| (IQR=Q_3-Q_1) | Calculate the interquartile range |
| (\hat{p}=\frac{x}{n}) | Calculate a sample proportion when (x) is the number of successes |
| (z=\frac{x-\mu}{\sigma}) | Standardize a value when the population mean and standard deviation are known |
| (SE_{\bar{x}}=\frac{\sigma}{\sqrt{n}}) | Standard error of the sample mean when (\sigma) is known and observations meet the usual independence conditions |
For sample variance, a common formula is:
[
s^2=\frac{\sum (x_i-\bar{x})^2}{n-1}
]
The denominator (n-1) is used in the usual unbiased sample variance estimator. Do not confuse this with population variance, which is calculated using the full population and divides the sum of squared deviations by (N).
Greek Statistics Symbols
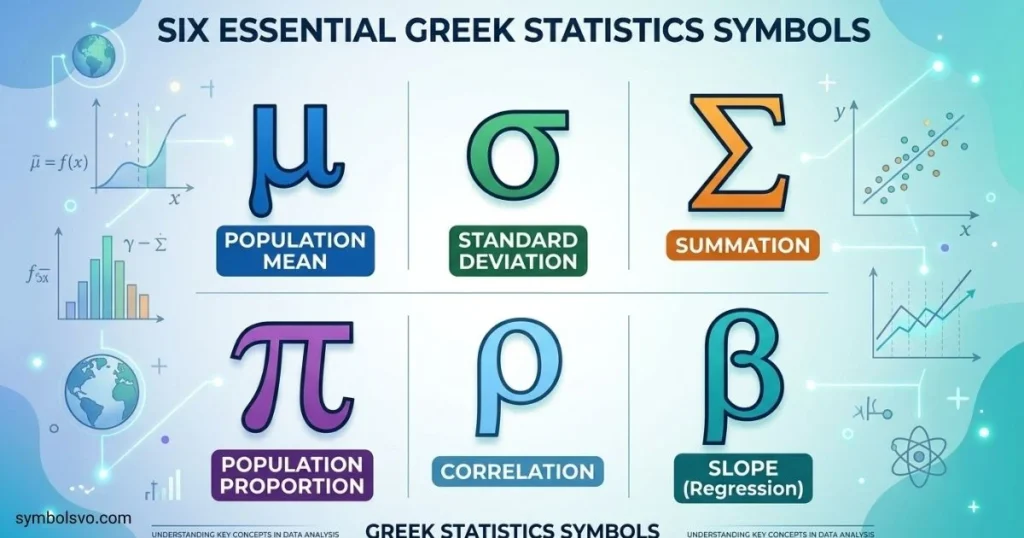
Greek letters are widely used in statistics to represent population parameters, model coefficients, probability values, and distributions. Many courses use Greek letters for population quantities and Latin letters for sample statistics, although this convention is not universal.
| Symbol | Name | Common statistical use |
| α | Alpha | Significance level or Type I error probability |
| β | Beta | Regression coefficient or Type II error probability |
| γ | Gamma | Parameter in certain distributions or models |
| Δ | Capital delta | Change or difference |
| δ | Lowercase delta | Difference or effect size in some contexts |
| ε | Epsilon | Error or disturbance term in a model |
| θ | Theta | General parameter |
| λ | Lambda | Rate parameter in some probability distributions |
| μ | Mu | Population mean |
| π | Pi | Mathematical constant; sometimes a population proportion in specialized notation |
| ρ | Rho | Population correlation coefficient |
| σ | Sigma | Population standard deviation |
| σ² | Sigma squared | Population variance |
| τ | Tau | Parameter or correlation measure in some methods |
| φ | Phi | Parameter, function, or probability notation in some fields |
| χ | Chi | Used in chi-square notation |
| Ω | Capital omega | Parameter space or another defined quantity in some contexts |
Greek Letters Commonly Used In Formulas
- (\mu): Often represents the average of an entire population.
- (\sigma): Often represents the population standard deviation.
- (\rho): Commonly represents population correlation.
- (\alpha): Often represents a chosen significance level in hypothesis testing.
- (\beta): Can represent a regression coefficient or the probability of a Type II error.
- (\theta): Frequently acts as a general name for an unknown parameter.
Greek letters do not have one fixed statistical meaning across every discipline. Check the notation used in the formula or textbook before interpreting a letter.
Sample Statistics Symbols
Sample statistics are numerical summaries calculated from sample data. They help researchers describe observations and estimate characteristics of a larger population.
A statistic is calculated from observed sample data. A parameter describes a population or a model. Statistics often use different symbols for these two concepts.
| Sample symbol | Name | Population counterpart | Meaning |
| (\bar{x}) | Sample mean | (\mu) | Average value |
| (s) | Sample standard deviation | (\sigma) | Spread around the mean |
| (s^2) | Sample variance | (\sigma^2) | Squared measure of spread |
| (\hat{p}) | Sample proportion | (p) | Proportion with a given characteristic |
| (r) | Sample correlation | (\rho) | Linear association between two variables |
| (\hat{\beta}) | Estimated regression coefficient | (\beta) | Estimated effect or slope parameter in a model |
| (\hat{\theta}) | Estimated parameter | (\theta) | Estimate of a general parameter |
| (n) | Sample size | (N) | Number of observations or population members |
Sample Statistics Example
Imagine that a school surveys 40 students to learn how many bring lunch from home. If 26 students bring lunch, the sample proportion is:
[
\hat{p}=\frac{26}{40}=0.65
]
The estimated proportion is 65%. The sample result does not automatically mean that exactly 65% of all students at the school bring lunch from home. The sample may differ from the full population.
Why The Hat Matters
A hat above a symbol often indicates an estimate. For example, (\hat{p}) is an estimate of (p), and (\hat{\theta}) is an estimate of a parameter called (\theta). The hat does not mean that the estimate is exact; it signals that the value was estimated from data or a statistical procedure.
Probability and Statistics Symbols
Probability and statistics are closely connected. Probability describes uncertainty using mathematical models, while statistical inference uses data to learn about populations and evaluate claims.
| Symbol | Name or meaning | Example |
| (P(A)) | Probability of event A | (P(A)=0.4) |
| (P(A\mid B)) | Probability of A given B | Chance of A when B is known to have occurred |
| (P(A\cap B)) | Probability of A and B | Both events occur |
| (P(A\cup B)) | Probability of A or B, or both | At least one event occurs |
| (A^c) | Complement of A | A does not occur |
| (P(A^c)) | Probability of the complement | (1-P(A)) |
| (X) | Random variable | A quantity whose value depends on an outcome |
| (\mathbb{E}(X)) | Expected value | Long-run average under the model |
| (\operatorname{Var}(X)) | Variance | Measure of spread |
| (\sigma) | Standard deviation | Spread of a distribution in population notation |
| (X\sim N(\mu,\sigma^2)) | Normal distribution notation | Mean (\mu), variance (\sigma^2) |
| (X\sim \operatorname{Bin}(n,p)) | Binomial distribution notation | (n) trials and success probability (p), under binomial assumptions |
| (z) | Z-score or z-statistic | Standardized value |
| (t) | T-statistic | Statistic used with a t-distribution |
| (\chi^2) | Chi-square statistic or distribution | Used in several categorical-data and variance procedures |
| (F) | F-statistic or F-distribution | Used in methods such as ANOVA |
Useful Probability Rules
The complement rule states:
[
P(A^c)=1-P(A)
]
For two events, the addition rule is:
[
P(A\cup B)=P(A)+P(B)-P(A\cap B)
]
If A and B are independent, their joint probability can be calculated as:
[
P(A\cap B)=P(A)P(B)
]
Independence is an assumption, not something that can be inferred just because two events are written in the same formula. If the events are dependent, the calculation may need conditional probability instead.
AP Statistics Symbols
AP Statistics courses use familiar symbols for describing data, studying probability, building confidence intervals, and conducting hypothesis tests. The exact notation may differ slightly between textbooks, teachers, and exam questions.
| Symbol | AP Statistics meaning |
| (\bar{x}) | Sample mean |
| (\mu) | Population mean |
| (s) | Sample standard deviation |
| (\sigma) | Population standard deviation |
| (\hat{p}) | Sample proportion |
| (p) | Population proportion or probability, depending on context |
| (n) | Sample size |
| (N) | Population size in many contexts |
| (r) | Sample correlation coefficient |
| (r^2) | Coefficient of determination in simple linear regression |
| (H_0) | Null hypothesis |
| (H_a) | Alternative hypothesis |
| (\alpha) | Significance level |
| (p\text{-value}) | Probability of a result at least as extreme as the observed result under the null model |
| (z) | Z-score or z-test statistic |
| (t) | T-test statistic |
| (df) | Degrees of freedom |
| (SE) | Standard error |
| (L) and (U) | Lower and upper confidence limits in some notation systems |
Common AP Statistics Formulas
Sample mean
[
\bar{x}=\frac{\sum x_i}{n}
]
Sample proportion
[
\hat{p}=\frac{x}{n}
]
Here, (x) is the number of successes and (n) is the number of observations.
Standard score
[
z=\frac{x-\mu}{\sigma}
]
This formula measures how many population standard deviations a value lies above or below the population mean, when (\mu) and (\sigma) are known.
Confidence interval for a population proportion
[
\hat{p}\pm z^*\sqrt{\frac{\hat{p}(1-\hat{p})}{n}}
]
This is a commonly taught one-proportion z-interval form. Its use depends on the sampling design and the required conditions. Some situations call for a different interval method.
Test statistic for a one-sample t-test
[
t=\frac{\bar{x}-\mu_0}{s/\sqrt{n}}
]
Here, (\mu_0) is the mean specified by the null hypothesis. The procedure relies on appropriate conditions concerning the data and sampling process.
AP Statistics Notation Tips
- Identify whether the question refers to a sample or a population.
- Read the subscript and any hat, bar, or exponent carefully.
- Separate the significance level (\alpha) from the calculated p-value.
- State conclusions in the context of the question instead of reporting a symbol or number alone.
- Follow the notation and conditions given in the question, even if your class normally uses a different convention.
Business Statistics Symbols
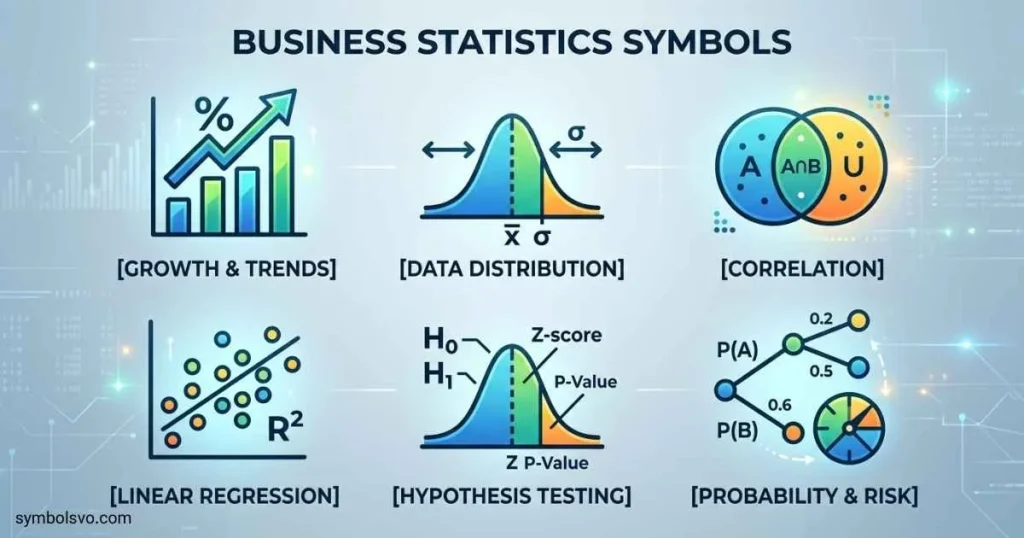
Business statistics applies statistical methods to sales, customer behavior, finance, operations, quality control, and business research. Many symbols are the same as those used in general statistics, but their interpretation depends on the business question and the model.
| Symbol | Common meaning | Business example |
| (\bar{x}) | Sample mean | Average order value in a sample of transactions |
| (\mu) | Population mean | Mean delivery time across all eligible orders |
| (s) | Sample standard deviation | Variation in sampled daily sales |
| (\sigma) | Population standard deviation | Variation in a defined population of measurements |
| (p) | Proportion or probability | Population conversion rate |
| (\hat{p}) | Sample proportion | Conversion rate observed in a campaign sample |
| (r) | Sample correlation | Relationship between advertising spend and sales |
| (\beta) | Regression coefficient | Estimated relationship between a predictor and a business outcome |
| (\alpha) | Significance level | Threshold selected for a statistical test |
| (R^2) | Coefficient of determination | Proportion of observed outcome variation explained by a fitted regression model |
| (n) | Sample size | Number of customers surveyed |
| (N) | Population size | Number of eligible customers in a defined group |
| (P(A)) | Probability | Chance of a specified business event |
| (E(X)) | Expected value | Long-run average outcome under a probability model |
| (C) | Cost or another defined quantity | Meaning must be specified by the model |
| (R) | Revenue, range, or another defined quantity | Meaning depends on the formula |
Example: Average Order Value
Suppose a sample of 100 orders has a total value of $5,000. The sample mean order value is:
[
\bar{x}=\frac{5000}{100}=$50
]
The average order value in the sample is $50. A business might use this statistic to compare sales channels or estimate the average value of orders across a wider customer population.
Example: Conversion Rate
If 240 of 2,000 website visitors make a purchase, the observed conversion proportion is:
[
\hat{p}=\frac{240}{2000}=0.12=12%
]
This is the sample conversion rate. Before deciding that a campaign performs better than another, a business should consider sample size, uncertainty, how visitors were selected, and whether other factors differ between the campaigns.
Example: Regression
A business may use a regression model to examine how advertising spend relates to sales. In a simple linear model,
[
\hat{y}=b_0+b_1x
]
(\hat{y}) is the predicted outcome, (b_0) is the estimated intercept, (b_1) is the estimated slope, and (x) is the predictor. The symbols used for regression coefficients can vary, so consult the model’s notation key.
Frequently Asked Questions
What Are The Most Common Statistics Symbols?
The most common symbols in introductory statistics include (\bar{x}) for the sample mean, (\mu) for the population mean, (s) for sample standard deviation, (\sigma) for population standard deviation, (n) for sample size, (\hat{p}) for sample proportion, and (r) for sample correlation.
What Is The Difference Between μ And X-Bar?
The symbol (\mu) usually represents the mean of an entire population, while (\bar{x}) represents the mean calculated from a sample. Researchers often use the sample mean to estimate the population mean.
What Does Sigma Mean In Statistics?
The lowercase Greek letter (\sigma) commonly represents population standard deviation. The symbol (\sigma^2) represents population variance. The capital Greek letter (\Sigma), written as (\sum), is the summation sign used to indicate that values should be added.
How Can I Copy And Paste Statistics Symbols?
Find the required symbol in the copy-and-paste table, select it, and copy it into your document or application. For notation such as x-bar or p-hat, use an equation editor if the combining mark does not display correctly.
What Is The Difference Between A Statistic And A Parameter?
A statistic is calculated from sample data, while a parameter describes a population or a statistical model. For example, (\bar{x}) is a sample mean statistic, whereas (\mu) is a population mean parameter.
Conclusion
Statistics symbols make data easier to describe, compare, and analyze. Symbols such as (\bar{x}), (\mu), (s), (\sigma), (\hat{p}), and (r) represent key ideas that appear throughout introductory statistics, probability, research, and business analysis.
Use the symbol lists, examples, and cheat sheet as a quick reference when studying formulas or preparing reports. Pay special attention to the difference between sample statistics and population parameters, since confusing them can lead to incorrect calculations or interpretations.
The best way to learn statistical notation is to connect each symbol with its meaning and see how it works in a formula. Keep this guide nearby as you practice, and check your textbook or course notes whenever a symbol has more than one possible meaning.

I’m Daniel Brooks, a content creator and symbol enthusiast dedicated to researching the fascinating world of signs and symbols. I enjoy discovering the hidden meanings behind famous icons, emojis, historical emblems, and cultural symbols. Through my writing, I aim to provide trustworthy, well-researched, and reader-friendly information that helps people learn something new with every visit.
Books:
- The Complete Guide to World Symbols
- The Power of Universal Signs
 Nathan Holloway
 Mason Ellington